
Charts in WPF C# – OxyPlot
An inherent element of working on numerical data is their analysis. And what form of data interpretation could be more pleasing to the eye than the dependency chart? Therefore, the entry will concern a tool that allows you to draw charts in WPF C # – OxyPlot that facilitates this task.
Charts in WPF C# – OxyPlot
In projects that require a few points to be displayed in a simple way, you can easily do it with your own classes. Sometimes, however, the amount of data increases and the display method is complicated, eg by the logarithmic scale, the possibility of zooming in on a part of the graph. In such situations, programming such a tool can take a significant amount of time for the original project. It is worth using the extensive tools that will definitely meet our requirements.
There are many tools on the market that support the display of charts, for example XPlot, Chart, ZedGraph. Most of the tools are written under WinForms and they work great there. What if the project is designed from the beginning to the end in WPF? You can of course connect the WPF project with WinForms, but there is a tool that solves this problem.
OxyPlot is a library that allows direct implementation in WPF, Windows 8, Windows Phone, Windows Phone Silverlight, Windows Forms, Silverlight, GTK #, Xwt, Xamarin.iOS, Xamarin.Android, Xamarin.Forms and Xamarin.Mac. It is available under the MIT license, which allows you to use it freely, as long as the content of the license is included in the derivative programs.
Contents
Where to start – Charts in WPF C# – OxyPlot
Work with OxyPlot should start with adding libraries to your own WPF project. There are three ways to add the appropriate references:
The easiest way to do this is to use nuget. After launching the Package Manager Console, enter:
– Install-Package Oxyplot.Core
– Install-Package Oxyplot.Wpf
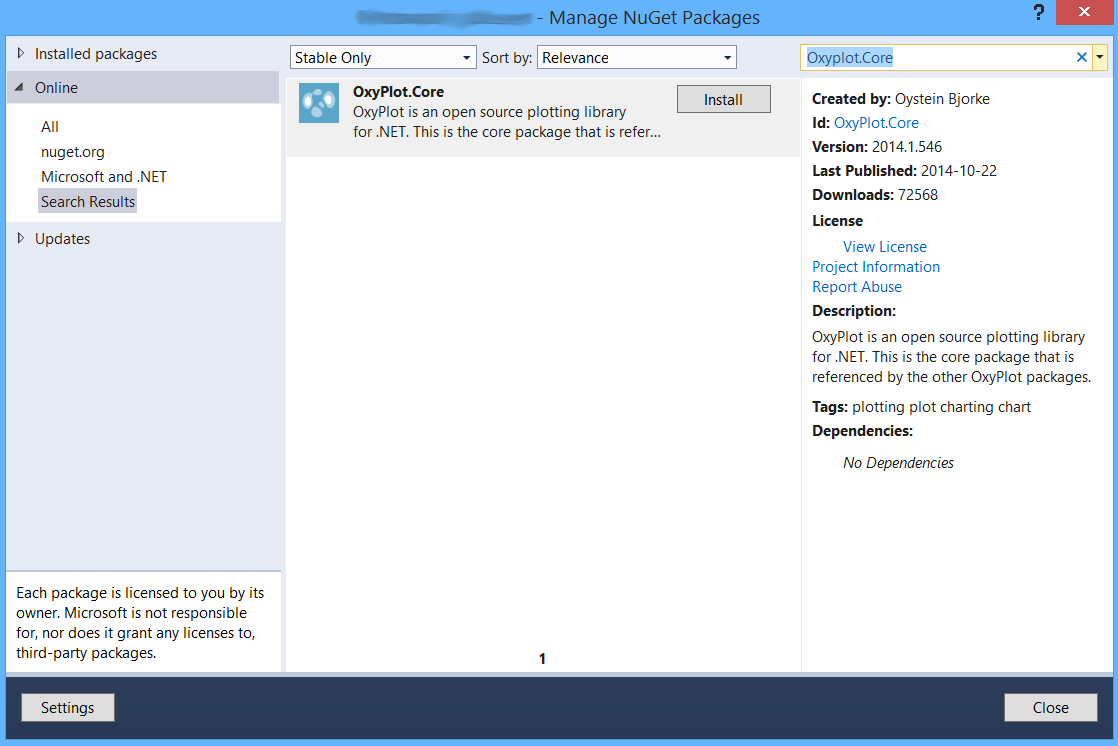
The second way is to search for the Oxyplot.Core and Oxyplot.Wpf libraries through the nuget interface – Manage Nuget Packages as shown below:
The third way is for those who do not work the previous ways.
Charts in WPF C# – OxyPlot
This method should be used if there was a problem during the installation, some OxyPlot functions do not work or for some reason you do not want to use nugets.
ATTENTION
Both the description and the examples provided by the manufacturer refer to the version 2013.1.38.1, unfortunately the version currently in the nuget is 2014.1.546 and may cause errors. One of them is:
The name “plot” does not exist in the namespace “http://oxyplot.codeplex.com”
The solution to this problem is to add references to an older version of the files that can be downloaded from here:
The downloaded file should be unpacked and then a reference should be added to them as shown below:
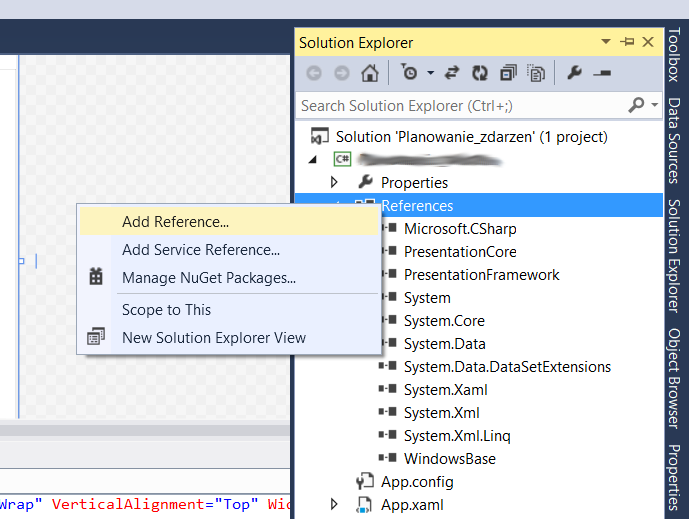
1. In Solution Explorer, find the reference, right-click and select Add Reference.
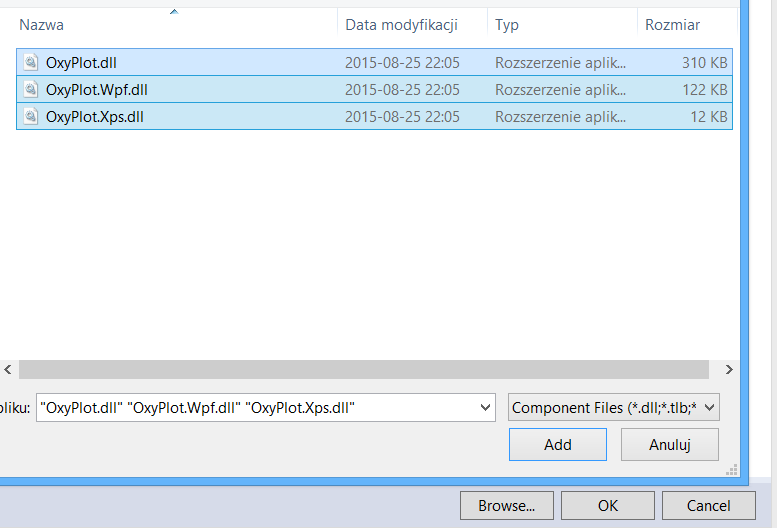
2. In the newly opened window, click Browse and find the downloaded files, then click Add.
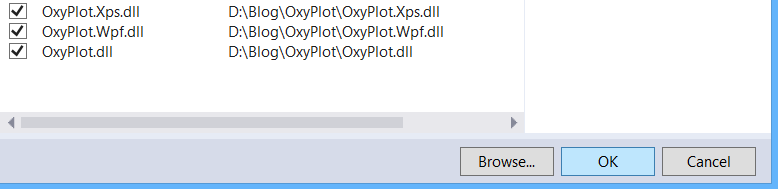
3. Finally, check whether they are marked on the list and click OK.
ATTENTION
The addition of any file by nuget will update files to a newer version. If the error mentioned above occurs, it will appear again.
Declaration of the graph control
The control should be declared in the XAML code of the project. In the Window header, a line should be added:
xmlns:oxy="http://oxyplot.codeplex.com"Then, in the place where the graph should appear, enter the code:
<oxy:Plot x:Name="Plot1" Title="A Graph" Model="{Binding PlotModel}" Margin="10" Grid.Row="1"> </oxy:Plot>The parameter worth clarifying here is the Model to which Binding has been set. This is a parameter that allows you to set the appearance, range, colors, data series, etc.
OxyPlot, despite functioning in WPF and the Binding Model, does not fully support the MVVM model (Model View ViewModel). This means that displaying changes in the graph requires updating the data in the PlotModel object in code-behind.
Implementation of the PlotModel object of the chart
Now that there is a control in the project in which the graph will be displayed, its appearance should be taken care of.
The model has been set to Binding, so it is necessary to declare the class with a field whose change will trigger a reaction through accessors. This class must inherit from INotifyPropertyChanged and override the OnPropertyChanged method:
public class OxyPlotModel : INotifyPropertyChanged
{

  private OxyPlot.PlotModel plotModel;
  public OxyPlot.PlotModel PlotModel
  {
      get
      {
         return plotModel;
      }
      set
      {
         plotModel = value;
         OnPropertyChanged("PlotModel");
      }
  }

  public event PropertyChangedEventHandler PropertyChanged;
  protected void OnPropertyChanged(string name)
  {
     PropertyChangedEventHandler handler = PropertyChanged;
     if (handler != null)
     {
        handler(this, new PropertyChangedEventArgs(name));
     }
  }
}
The object of the defined class should be connected to the interface with the graph control.
//Declaration of the object
private OxyPlotModel oxyPlotModel;

//In the constructor
oxyPlotModel = new OxyPlotModel();
this.DataContext = oxyPlotModel; // This allows you to combine controls with OxyPlotModel classes
Setting chart parameters
Now that everything is connected to each other, the setting of the appropriate parameters of the PlotModel field remains. For this purpose, the OxyPlotModel class will be expanded. The method of supplementing these parameters is arbitrary, but in the following example it has been separated into two stages. Parameters that do not change are replenished at the beginning, and those dependent on the chart are added before displaying. Fixed parameters are only those relating to the chart legend:
private void SetUpLegend()
{
  plotModel.LegendTitle = "Legenda";
  plotModel.LegendOrientation = OxyPlot.LegendOrientation.Horizontal;

  //Horizontal orientation
  plotModel.LegendPlacement = OxyPlot.LegendPlacement.Outside; //In addition to the chart plot
  plotModel.LegendPosition = OxyPlot.LegendPosition.TopRight; //Position: up, right
  plotModel.LegendBackground = OxyPlot.OxyColor.FromAColor(200, OxyPlot.OxyColors.White);//White background
  plotModel.LegendBorder = OxyPlot.OxyColors.Black; //Window frame black
}
I do not recommend the initial declaration of the axis of the chart, because the numerical values from the declarations and from the input data themselves can overlap and this will cause a visual mess.
The second class method, called whenever the chart content needs to be changed. The simplest example allowing to draw a cosine is the method:
public void PodajDaneDoWykresu()
{
  this.MyModel = new PlotModel { Title = "Przykład 1" };
  this.MyModel.Series.Add(new FunctionSeries(Math.Cos, 0, 10, 0.1, "cos(x)"));
}
In the case of a graph based on its own X and Y points, the same class would look like this:
public IList<OxyPlot.DataPoint> Points { get; private set; }
public void PodajDaneDoWykresu()
{
  this.plotModel.Title = "Przykład 2";
  this.Points = new List<OxyPlot.DataPoint>
  {
    new OxyPlot.DataPoint(5, 3),
    new OxyPlot.DataPoint(15, 17),
    new OxyPlot.DataPoint(25, 12),
    new OxyPlot.DataPoint(35, 4),
    new OxyPlot.DataPoint(45, 15),
    new OxyPlot.DataPoint(55, 10)
  };
}
or:
OxyPlot.Series.LineSeries punktySerii;
public void PodajDaneDoWykresu()
{
  this.plotModel.Title = "Przykład 3";

  punktySerii.Points.Add(new OxyPlot.DataPoint(5, 3));
  punktySerii.Points.Add(new OxyPlot.DataPoint(15, 17));
  punktySerii.Points.Add(new OxyPlot.DataPoint(25, 12));
  punktySerii.Points.Add(new OxyPlot.DataPoint(35, 4));
  punktySerii.Points.Add(new OxyPlot.DataPoint(45, 15));
  punktySerii.Points.Add(new OxyPlot.DataPoint(55, 10));

  plotModel.Series.Add(punktySerii);
}
In addition, this method can be supplemented with information on the axis axis parameters such as linear / logarithmic, data range, and minimum / maximum value:
var xAxis = new OxyPlot.Axes.LinearAxis(OxyPlot.Axes.AxisPosition.Bottom, "a - offered traffic [Erl]")
{
  MajorGridlineStyle = OxyPlot.LineStyle.Solid,
  MinorGridlineStyle = OxyPlot.LineStyle.Dot
};
plotModel.Axes.Add(xAxis); var yAxis = new OxyPlot.Axes.LogarithmicAxis(OxyPlot.Axes.AxisPosition.Left, "Ei")
{
  MajorGridlineStyle = OxyPlot.LineStyle.Solid,
  MinorGridlineStyle = OxyPlot.LineStyle.Dot
};
plotModel.Axes.Add(yAxis);
If the series of data is more then it is worth to be clearly different from each other, therefore you should define the parameters of the series:
//declaration outside the method
OxyPlot.Series.LineSeries punktySerii;

//implementation in the method
punktySerii = new OxyPlot.Series.LineSeries
{
  MarkerType = OxyPlot.MarkerType.Plus, //marking of points
  MarkerSize = 4, //point size
  MarkerStroke = OxyPlot.OxyColors.Tomato, //The color of the chart line
  Title = "Seria danych" //title of the series
};
Collecting all the information discussed below, the code for the data series given as a list in the parameter was presented below:
public void PodajDaneDoWykresu(List<double> X, List<double> Y)//List X and Y given as a method parameter
{
  this.PlotModel = new OxyPlot.PlotModel();
  //Removing the set parameters from the previous method run
  plotModel.Series = new System.Collections.ObjectModel.Collection<OxyPlot.Series.Series> { };
  plotModel.Axes = new System.Collections.ObjectModel.Collection<OxyPlot.Axes.Axis> { };


  //Graphical graph settings
  punktySerii = new OxyPlot.Series.LineSeries
  {
    MarkerType = ksztaltPunktowWykresu[0], //point marking - definition below
    MarkerSize = 4, //point size
    MarkerStroke = koloryWykresow[0], //Chart line color - definition below
    Title = "Seria nr: " + (1).ToString() //title of the series
  };

  //Supplementing data
  for (int n = 0; n < X.Count; n++)
    punktySerii.Points.Add(new OxyPlot.DataPoint(X[n], Y[n]));//adding all series to the chart

  plotModel.Series.Add(punktySerii);

  //Description and parameters of the chart's axis
  var xAxis = new OxyPlot.Axes.LinearAxis(OxyPlot.Axes.AxisPosition.Bottom, "a - offered traffic [Erl]")
  {
    MajorGridlineStyle = OxyPlot.LineStyle.Solid,
    MinorGridlineStyle = OxyPlot.LineStyle.Dot
  };
  plotModel.Axes.Add(xAxis);
  var yAxis = new OxyPlot.Axes.LogarithmicAxis(OxyPlot.Axes.AxisPosition.Left, "Ei")
  {
    MajorGridlineStyle = OxyPlot.LineStyle.Solid,
    MinorGridlineStyle = OxyPlot.LineStyle.Dot
  };
  plotModel.Axes.Add(yAxis);
}
In the above code, the series used subsequent values of tables ksztaltPunktowWykresu and koloryWykresow. These are lists with listed values of these parameters, so that you can use them in a loop. An example of implementation of such tables is below:
//Printed to change the color and shape with the class number
private readonly List<OxyPlot.OxyColor> koloryWykresow = new List<OxyPlot.OxyColor>
{
  OxyPlot.OxyColors.Green,
  OxyPlot.OxyColors.IndianRed,
  OxyPlot.OxyColors.Coral,
  OxyPlot.OxyColors.Chartreuse,
  OxyPlot.OxyColors.Peru
};

private readonly List<OxyPlot.MarkerType> ksztaltPunktowWykresu = new List<OxyPlot.MarkerType>
{
  OxyPlot.MarkerType.Plus,
  OxyPlot.MarkerType.Star,
  OxyPlot.MarkerType.Cross,
  OxyPlot.MarkerType.Custom,
  OxyPlot.MarkerType.Square
};
Record the chart to a file
When we have worked so hard to display the graph, it would be good to keep it in the form of a file for later reproduction. OxyPlot allows you to use the keyboard shortcut ctrl + c to save its image in temporary memory, then simply paste it in any graphic editor.
A more convenient option, however, is to use a method that allows such a file to be saved:
OxyPlot.Wpf.PngExporter.Export(PlotModel, filename, 1600, 1600, OxyPlot.OxyColors.White, 96);The parameters of the method are:
– Object with a chart model;
– The file name, including location and extension;
– Width in pixels;
– Height in pixels;
– Chart background color;
– The number of pixels per inch;


